
![]() An interesting paper on health factors and automated feeders for calves was published in the July, 2017 Journal of Dairy Science. See the reference at the end of this post. Researchers evaluated calf health measures on 38 farms in MN, WI and IA. These farms represented about 60% of the automated feeding systems in use in the region at the time of the study. There were 10,179 calves enrolled in the study, averaging 45 calves per farm. The range was from 7 to 300 calves.
An interesting paper on health factors and automated feeders for calves was published in the July, 2017 Journal of Dairy Science. See the reference at the end of this post. Researchers evaluated calf health measures on 38 farms in MN, WI and IA. These farms represented about 60% of the automated feeding systems in use in the region at the time of the study. There were 10,179 calves enrolled in the study, averaging 45 calves per farm. The range was from 7 to 300 calves.
Attitude, ear position, eye and nasal discharge, cleanliness and body temperature were recorded on each farm. Farm management practices were also recorded and evaluated for relationships to health parameters . These management summaries are very interesting on their own and I have arranged them into tables for quick review.
Housing Characteristics
Facilities
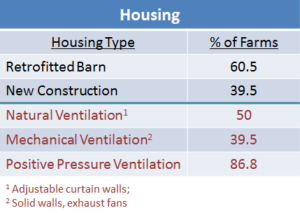
The predominant housing type was retrofitted barns. Calves were housed in structures that had been modified for the automated feeders on 60.5% of farms. The remaining 39.5% of farms built new structures to house calves and the feeding system.
Fifty percent of farms used natural ventilation with adjustable curtain sidewalls. Mechanical ventilation with solid walls and exhaust fans was used on 39.5% of farms. Nearly 87% of farms used positive pressure ventilation tubes.
Group Pens
Calves were held in separate pens for an average of 5.1 days before being introduced to the group pen and the automated feeders. Twenty-six percent of farms introduced calves to the feeder on day 1.
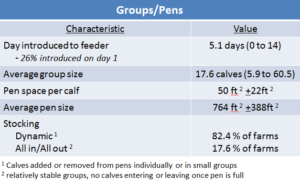 Average group size was 17.5 calves, but ranged from 5.9 to 60.5 calves. Space per calf averaged 50 ft2, ranging from 28 to 77 ft2 (recommended space per calf is 35 ft2 min). Average pen size was 764 ft2, varying from 376 to 1152 ft2.
Researchers found a stronger correlation between space per calf and health scores than between group size and health scores. Increased stocking density was associated with adverse health events.
Rectangular pens where the length was at least twice the width had better health scores. This may be due to a better fit of rectangular pens to positive pressure ventilation systems and the density of airborne pathogens.
Most calves (82.4%) were added to and removed from pens individually or in small groups in a dynamic stocking pattern. All in/All out groups where no calves enter or leave once the pen is full are relatively stable and are used on 17.6% of farms.
Bedding
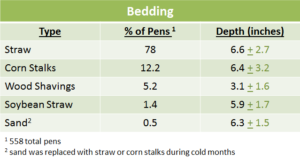
Straw was the most common bedding choice. Seventy-eight percent of pens were bedded with straw. Corn stalks were used in 12.2% of pens, followed by wood shavings (5.2%) and soybean straw, (1.4%). Sand was used the least, being found in only 0.5% of pens. Sand was replaced by either straw or corn stalks during the cold season. One retrofitted barn had slatted floors where no bedding was used.
Feed Management
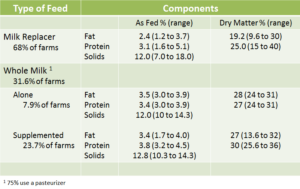
Milk replacer was used on 68.4% of farms. Only 7.9% of farms fed whole milk alone, with 23.7% of farms feeding both whole milk plus a milk replacer supplement. Seventy-five percent of farms feeding whole milk used a pasteurizer.
Components
Milk replacer averaged 3.1% protein and 2.4% fat on an As Fed basis. This is milk replacer that’s been mixed with water. Expressed on a Dry Matter basis, as you would find listed on a bag of milk replacer, average protein and fat percentages would be about 25 and 19.2, respectively. These average values are not unexpected.
What is really telling here is the variation among samples. Variation on an As Fed basis was from 1.6 to 5.1% for protein and from 1.2 to 3.7% for fat. On a Dry Matter basis, protein values varied from 15 to 40%, and fat from 9.6 to 30%. Low and high protein and fat values are well outside the ranges expected for normal milk replacer formulations. Combined with the large variation in solids percentage (7 to 18%), it becomes apparent that many automated feeders are not mixing water and powder as expected. This is likely a feeder calibration issue.
The average protein and fat percentages for whole milk were 3.4 and 3.5%, respectively, ranging from 3.0 to 3.9%. Milk solids is typically between 12.5 and 13% in whole milk. Waste milk may show greater variability, depending on the animals that make up the pool of waste milk at any time. Low values, such as those around 10%, may indicate incorporation of water during waste milk collection.
Feed Allowance
Feed Allowances with Automated Feeders
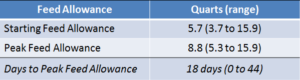
The average starting feed allowance was 5.7 quarts per day, with peak allowance averaging 8.8 quarts. The average feed plan took 18 days for calves to reach peak feed allowance. There was a lot a variability in feed allowance parameters among farms.
The study showed that a higher feed allowance was associated with cleaner calves (less manure). Each day to reach peak milk allowance was associated with an increased likelihood of poorer health scores. Researchers noted that there may be an advantage to calf health by increasing daily feed allowance rapidly rather than gradually.
Weaning
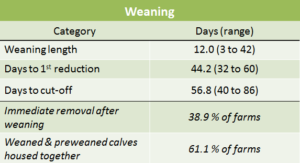
Most farms implemented a gradual weaning strategy. Average weaning length was 12 days. The weaning process began when calves were 44.5 days old. This means the average time on the feeder was 39.3 days when weaning began. Calves were cut off from the feeder at 56.8 days of age. Calves were removed from the pen after weaning on 38.9% of farms. Weaned and pre-weaned calves stayed together on 61.1% of farms.
Bacterial Contamination of Automated Feeders
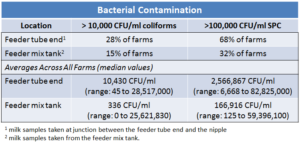
Milk samples were collected from the feeder mix tank and the tube end at the junction with the nipple. Samples were evaluated for both coliforms and SPC (standard plate count). Coliforms should be below 10,000 colony forming units (cfu)/ml. SPC should be below 100,000 cfu/ml.
Tube End
Results showed that 28% of farms had coliform levels >10,000 cfu/ml and 68% of farms had SPC >100,000 cfu/ml. The median coliform value for tube end samples across all farms was 10,430 cfu/ml but the range was from 45 to 28,517,000 cfu/ml.The median SPC value at the tube end was 2,566,967 cfu/ml – well over the goal of <100,000 SPC. Samples ranged from 6,668 to 82,825,000 cfu/ml.
Mix Tank
results showed that 15% of farms had coliform levels >10,000 cfu/ml and 32% of farms had SPC >100,000. The median coliform value for mix tank samples was 336 cfu/ml. The range was from 0 to 25,621,830 cfu/ml. The median SPC value was 166,916 cfu/ml, which is above the 100,000 cfu/ml threshold. The range for milk tank SPC was 125 to 59,396,100 cfu/ml.
Automated feeders have several potential reservoirs for bacteria: the feeder tube, mix tank, milk powder storage, whole milk storage/delivery and the nipple. Machine installation and maintenance errors that allow milk to pool within the system could contribute to bacterial growth.
From an animal health standpoint, researchers report that SPC >100,000 cfu/ml increased the odds of poorer health scores. The relative frequency of pathogens is cause for major concern regarding the intake of pathogens by calves at automatic feeders.
Seasonality Affects Health Factors
Fall and winter scores were associated with worse health outcomes. The researchers noted that seasonal conditions can put stress on calves, and not implementing management strategies to address seasonal changes can have adverse effects on calf health and survival. In other words, these seasonal effects may have less to do with the automated feeders and more to do with calf management practices.
Conclusions
Feeder management jumps out as an area that needs attention on many farms. The high degree of component variability of mixed milk replacer samples points to a need for feeder calibration. Calibration has either drifted or was not set up correctly during installation. High bacteria counts in the mix tank and feeder tubes point to feeder cleaning or equipment installation issues. Implementing and evaluating effective manual and automatic cleaning processes and assuring milk is not allowed to pool in the system between cleaning are important steps to reduce and maintain low bacteria counts.
The authors noted that aspects of the feeding plan, group size, stocking management, ventilation and bacterial contamination were associated with health scores. They point to bacterial contamination and the speed at which calves reach peak milk allowance as factors that appeared across several health score categories and may have more significance.
_________________________________
Reference
Jorgensen, M.W., A. Adams-Progar, A. M. dePassille, J. Rushen, S. M. Godden, H. Chester-Jones, M. I. Endres. 2017. Factors associated with dairy calf health in automated feeding systems in the Upper Midwest United States. J. Dairy Sci. 100:5675-5686. https://doi.org/10.3168/jds.2016-12501
_________________________________
Other Posts About Automated Feeders
- Automatic Feeding of Calves in Individual Pens
- Milk Replacer Considerations With Automatic Calf Feeders